CloudNet@ 가시다님이 진행하는 Istio In Action 책 기반 Hands-on Study Chap.7 관찰가능성: 서비스의 동작 이해하기
목차
- 1.관찰 가능성이란?
- 2.Istio Metric
- 3.Prometheus로 Istio Metric 가져오기
- 4.Istio 표준 Metric 커스터마이징하기
1. 관찰 가능성이란?
개요
현대 애플리케이션은 일반적으로 마이크로서비스 아키텍처(MSA)로 구성되어 있습니다. 이러한 구조는 기존의 단일 Monolith 아키텍처에 비해 복잡도가 크게 증가하며, 서비스 간 의존성이 높아져 고려해야 할 요소들이 기하급수적으로 늘어납니다
이처럼 시스템이 점점 복잡해짐에 따라 관리해야 할 애플리케이션의 수가 급격히 증가하고, 관리 포인트를 놓치거나 특정 애플리케이션에 트래픽이 집중되는 문제가 발생할 수 있습니다
이러한 문제를 안정적으로 해결하고 평균 복구 시간(Mean Time To Recovery, MTTR)을 단축하기 위해 관찰 가능성(Observability) 이라는 개념이 자주 등징하기 시작했습니다.
관찰 가능성의 개념과 정의
관찰 가능성 이란 시스템의 외부에서 관찰 가능한 신호(지표, 로그, 추적 등)를 통해 시스템 내부 상태를 이해하고 추론할 수 있는 능력 이라고 합니다.
관찰 가능성 을 통해 시스템에 문제가 발생했을 때, 다양한 Metric 정보를 유기적으로 활용하여 문제의 원인을 신속하게 파악하고 해결할 수 있어야 합니다
Istio는 관찰 가능성 중 애플리케이션 계층의 네트워크 계측 을 보조하며, 서비스 간 트래픽 흐름과 상태를 보다 쉽게 파악 할 수 있도록 도와주는 역할을 수행합니다.
관찰 가능성과 모니터링 비교
모니터링 은 시스템 장애 유발 가능성이 있는 지표(Metric, log, trace 등)를 수집하고, 이를 기준과 비교하여 상태를 진단하는 활동입니다(Ex 디스크 사용량, 메모리 사용량)
모니터링 개념은 관찰 가능성의 부분집합 이며, 관찰 가능성은 기존 모니터링만으로는 해결할 수 없는, 예측하지 못한 장애 상황까지 진단할 수 있는 개념 입니다.
예를 들어 장애로까지 이어지지 않더라도 사용자 경험에 영향을 줄 수 있는 지연이나 성능 저하가 발생했을 때, 관찰 가능성을 충분히 확보한 시스템이라면 문제 발생 지점을 정확하게 파악할 수 있습니다
Istio와 관찰 가능성의 연관성
Istio는 서비스 메시 내에서 각 애플리케이션 앞단에 Istio-proxy(Envoy)를 사이드카로 배치하여, 서비스 간 네트워크 트래픽을 투명하게 계측하고 관찰할 수 있도록 지원합니다
이를 통해 요청 처리 수, 처리 시간, 실패 요청 건수 등 다양한 네트워크 Metric을 자동으로 수집할 수 있으며, 필요에 따라 추가 Metric도 정의할 수 있습니다
Istio에서는 이런 관찰 가능성 을 돕기 위해 Prometheus, Kiali, Grafana, Jaeger 같은 도구들을 지원합니다.
2.Istio Metric
DataPlane의 Metric
Istio의 Data Plane에서는 연결(Connection), 요청(Request), 런타임(Runtime) 등 다양한 Metric을 수집하여 서비스 간 네트워크 상태를 파악할 수 있게 합니다
실습을 통해 Istio-Proxy의 Metric 을 통해 시각화하여 관찰 가능할 수 있는 시스템을 구성 해 보겠습니다.
# 실습 환경 준비
kind create cluster --name myk8s --image kindest/node:v1.23.17 --config - <<EOF
kind: Cluster
apiVersion: kind.x-k8s.io/v1alpha4
nodes:
- role: control-plane
  extraPortMappings:
  - containerPort: 30000 # Sample Application (istio-ingrssgateway) HTTP
    hostPort: 30000
  - containerPort: 30001 # Prometheus
    hostPort: 30001
  - containerPort: 30002 # Grafana
    hostPort: 30002
  - containerPort: 30003 # Kiali
    hostPort: 30003
  - containerPort: 30004 # Tracing
    hostPort: 30004
  - containerPort: 30005 # Sample Application (istio-ingrssgateway) HTTPS
    hostPort: 30005
  - containerPort: 30006 # TCP Route
    hostPort: 30006
  - containerPort: 30007 # kube-ops-view
    hostPort: 30007
  kubeadmConfigPatches:
  - |
    kind: ClusterConfiguration
    controllerManager:
      extraArgs:
        bind-address: 0.0.0.0
  extraMounts: # 해당 부분 생략 가능
  - hostPath: /home/duswn916/istio-in-action/book-source-code-master # 각자 자신의 pwd 경로로 설정
    containerPath: /istiobook
networking:
  podSubnet: 10.10.0.0/16
  serviceSubnet: 10.200.1.0/24
EOF

# myk8s-control-plane 진입 후 설치 진행
docker exec -it myk8s-control-plane bash
apt update && apt install tree psmisc lsof wget bridge-utils net-tools dnsutils tcpdump ngrep iputils-ping git vim -y

# istioctl 설치
export ISTIOV=1.17.8
echo 'export ISTIOV=1.17.8' >> /root/.bashrc

curl -s -L https://istio.io/downloadIstio | ISTIO_VERSION=$ISTIOV sh -
cp istio-$ISTIOV/bin/istioctl /usr/local/bin/istioctl
istioctl version --remote=false

# default 프로파일 컨트롤 플레인 배포
istioctl install --set profile=demo -y

# 빠져나오기
exit


# 실습을 위한 네임스페이스 설정
kubectl create ns istioinaction
kubectl label namespace istioinaction istio-injection=enabled

# istio-ingressgateway 서비스 : NodePort 변경 및 nodeport 지정 변경 , externalTrafficPolicy 설정 (ClientIP 수집)
kubectl patch svc -n istio-system istio-ingressgateway -p '{"spec": {"type": "NodePort", "ports": [{"port": 80, "targetPort": 8080, "nodePort": 30000}]}}'
kubectl patch svc -n istio-system istio-ingressgateway -p '{"spec": {"type": "NodePort", "ports": [{"port": 443, "targetPort": 8443, "nodePort": 30005}]}}'
kubectl patch svc -n istio-system istio-ingressgateway -p '{"spec":{"externalTrafficPolicy": "Local"}}'


# 내부 접속 테스트용 netshoot 파드 생성
cat <<EOF | kubectl apply -f -
apiVersion: v1
kind: Pod
metadata:
  name: netshoot
spec:
  containers:
  - name: netshoot
    image: nicolaka/netshoot
    command: ["tail"]
    args: ["-f", "/dev/null"]
  terminationGracePeriodSeconds: 0
EOF
# host파일에 등록
echo "127.0.0.1       webapp.istioinaction.io" | sudo tee -a /etc/hosts

# catalog 앱 기동
kubectl apply -f services/catalog/kubernetes/catalog.yaml -n istioinaction

# webapp 앱 기동
kubectl apply -f services/webapp/kubernetes/webapp.yaml -n istioinaction

# gateway, virtualservice 설정
kubectl apply -f services/webapp/istio/webapp-catalog-gw-vs.yaml -n istioinaction

# 호출테스트
curl -s http://webapp.istioinaction.io:30000
curl -s http://webapp.istioinaction.io:30000/api/catalog | jq
curl -s http://webapp.istioinaction.io:30000/api/catalog | jq

# 쿼리를 실행해 파드의 통계 확인 : 정보가 많음. 프록시가 보관하는 정보는 휠씬 더 많지만, 대부분은 기본적으로 제거됨.
kubectl exec -it deploy/catalog -c istio-proxy -n istioinaction -- curl localhost:15000/stats
kubectl exec -it deploy/webapp  -c istio-proxy -n istioinaction -- curl localhost:15000/stats
# Result
cluster_manager.cds.version_text: "2025-05-02T11:53:00Z/12"
listener_manager.lds.version_text: "2025-05-02T11:53:00Z/12"
cluster.xds-grpc.assignment_stale: 0
cluster.xds-grpc.assignment_timeout_received: 0
cluster.xds-grpc.bind_errors: 0
....
listener_manager.lds.update_duration: P0(nan,1) P25(nan,1.05) P50(nan,1.1) P75(nan,2.1) P90(nan,32.6) P95(nan,32.8) P99(nan,32.96) P99.5(nan,32.98) P99.9(nan,32.996) P100(nan,33)
server.initialization_time_ms: P0(nan,190) P25(nan,192.5) P50(nan,195) P75(nan,197.5) P90(nan,199) P95(nan,199.5) P99(nan,199.9) P99.5(nan,199.95) P99.9(nan,199.99) P100(nan,200)
인바운드 및 아웃바운드 호출에 측정되는 주요한 표준 Istio Metric
- istio_request_total
- Ingress Gateway에서 webapp 서비스로 들어오는 요청의 갯수에 대한 INTEGER TYPE Metric 입니다.
- istio_request_bytes
- 요청 전문에서 Body부분의 크기를 Byte로 표현한 DISTRIBUTION TYPE Metric 입니다.
- istio_response_bytes
- 응답 전문에서 Body부분의 크기를 Byte로 표현한 DISTRIBUTION TYPE Metric 입니다.
- istio_request_duration_milliseconds
- 요청 전문의 처리 시간을 표현한 DISTRIBUTION TYPE Metric 입니다.
표준 Istio Metric 말고도 더 상세한 정보를 표시 할 수 있도록 설정을 변경하는 방법은 다음과 같습니다.
# 방법 1 비추천, 메시 전체에서 수집하는 Metric이 증가하여 시스템을 과부화 상태로 만들 수 있어, 권장하지 않음
apiVersion: install.istio.io/v1alpha1
kind: IstioOperator
metadata:
  name: control-plane
spec:
  profile: demo
  meshConfig:
    defaultConfig: # Defines the default proxy configuration for all services
      proxyStatsMatcher: # Customizes the reported metrics
        inclusionPrefixes: # Metrics matching the prefix will be reported alongside the default ones.
        - "cluster.outbound|80||catalog.istioinaction"
# 방법 2 추천 워크로드 단위로 설정 (어노테이션으로 포함할 Metric 지정)
cat ch7/webapp-deployment-stats-inclusion.yaml
kubectl apply -f ch7/webapp-deployment-stats-inclusion.yaml -n istioinaction...
template:
metadata:
annotations:
proxy.istio.io/config: |-
proxyStatsMatcher:
inclusionPrefixes:
- "cluster.outbound|80||catalog.istioinaction"
labels:
app: webapp# 호출테스트
curl -s http://webapp.istioinaction.io:30000/api/catalog | jq
kubectl exec -it deploy/webapp -c istio-proxy -n istioinaction -- curl localhost:15000/stats | grep catalog# Upstream 클러스터로 향하는 Connection이나 요청에서 서킷 브레이커가 적용되는지 확인 가능
...
cluster.outbound|80||catalog.istioinaction.svc.cluster.local.upstream_cx_active: 2
cluster.outbound|80||catalog.istioinaction.svc.cluster.local.upstream_cx_total: 2
cluster.outbound|80||catalog.istioinaction.svc.cluster.local.upstream_cx_tx_bytes_buffered: 0
cluster.outbound|80||catalog.istioinaction.svc.cluster.local.upstream_rq_0rtt: 0
cluster.outbound|80||catalog.istioinaction.svc.cluster.local.upstream_rq_200: 3
...# East-West Traffic에 대한 Metric 확인 방법
kubectl exec -it deploy/webapp -c istio-proxy -n istioinaction -- curl localhost:15000/stats | grep catalog | grep internal# Result
...
cluster.outbound|80||catalog.istioinaction.svc.cluster.local.internal.upstream_rq_200: 3
cluster.outbound|80||catalog.istioinaction.svc.cluster.local.internal.upstream_rq_2xx: 3
cluster.outbound|80||catalog.istioinaction.svc.cluster.local.internal.upstream_rq_completed: 3
cluster.outbound|80||catalog.istioinaction.svc.cluster.local.upstream_internal_redirect_failed_total: 0
cluster.outbound|80||catalog.istioinaction.svc.cluster.local.upstream_internal_redirect_succeeded_total: 0
cluster.outbound|80||catalog.istioinaction.svc.cluster.local.internal.upstream_rq_time: P0(nan,5) P25(nan,5.075) P50(nan,6.05) P75(nan,61.25) P90(nan,61.7) P95(nan,61.85) P99(nan,61.97) P99.5(nan,61.985) P99.9(nan,61.997) P100(nan,62)
...# cluster_name.internal.*. Metric들을 보면 트래픽이 TLS로 UpStream Cluster로 이동 여부와 Coneection과 관련된 세부정보를 얻을 수 있습니다.
kubectl exec -it deploy/webapp -c istio-proxy -n istioinaction -- curl localhost:15000/stats | grep catalog | grep ssl# Result
...
cluster.outbound|80||catalog.istioinaction.svc.cluster.local.ssl.no_certificate: 0
cluster.outbound|80||catalog.istioinaction.svc.cluster.local.ssl.ocsp_staple_failed: 0
cluster.outbound|80||catalog.istioinaction.svc.cluster.local.ssl.ocsp_staple_omitted: 0
cluster.outbound|80||catalog.istioinaction.svc.cluster.local.ssl.ocsp_staple_requests: 0
cluster.outbound|80||catalog.istioinaction.svc.cluster.local.ssl.ocsp_staple_responses: 0
cluster.outbound|80||catalog.istioinaction.svc.cluster.local.ssl.session_reused: 1
cluster.outbound|80||catalog.istioinaction.svc.cluster.local.ssl.sigalgs.rsa_pss_rsae_sha256: 2
cluster.outbound|80||catalog.istioinaction.svc.cluster.local.ssl.versions.TLSv1.3: 2
...# svc.cluster.local.upstream_cx* ,svc.cluster.local.upstream_rq* Metric들은 각각 Envoy의 Connection 상태 및 Request에 관한 Metric들을 나타냅니다.
kubectl exec -it deploy/webapp -c istio-proxy -n istioinaction -- curl localhost:15000/stats | grep catalog | egrep 'local.upstream_cx|local.upstream_rq'
# Result
cluster.outbound|80||catalog.istioinaction.svc.cluster.local.upstream_cx_total: 2
cluster.outbound|80||catalog.istioinaction.svc.cluster.local.upstream_cx_tx_bytes_buffered: 0
cluster.outbound|80||catalog.istioinaction.svc.cluster.local.upstream_cx_tx_bytes_total: 3852
cluster.outbound|80||catalog.istioinaction.svc.cluster.local.upstream_rq_0rtt: 0
cluster.outbound|80||catalog.istioinaction.svc.cluster.local.upstream_rq_200: 3
cluster.outbound|80||catalog.istioinaction.svc.cluster.local.upstream_rq_2xx: 3
cluster.outbound|80||catalog.istioinaction.svc.cluster.local.upstream_rq_active: 0
cluster.outbound|80||catalog.istioinaction.svc.cluster.local.upstream_rq_cancelled: 0
cluster.outbound|80||catalog.istioinaction.svc.cluster.local.upstream_rq_completed: 3
이렇가 각각의 Istio-proxy 내부에 접근 하여 수집되고 있는 Metric 정보를 볼 수 있지만, 확인이 불편하기 때문에 Prometheus나 Datadog같은 Metric 수집 시스템에 저장을 하여 Metric을 확인 합니다.
Control Plane의 Metric
Istiod에서 많은 Metric들을 확인 할 수 있지만, 특정 Metric 만 알아보도록 하겠습니다.
# CSR : Certificate Signing Request 인증서 발급 요청
# Citadel : Istio 보안 컴포넌트
# 15014포트는 Metric 수집을 위해 노출된 포트입니다.
kubectl exec -it -n istio-system deploy/istiod -n istio-system -- curl localhost:15014/metrics | grep citadel
# Result
citadel_server_csr_count 5 # Control Plane으로 들어온 CSR 요청 갯수
citadel_server_root_cert_expiry_timestamp 2.061546606e+09 # 워크로드 인증서 만료 시점
citadel_server_success_cert_issuance_count 5 # 발급된 인증서 갯수kubectl exec -it -n istio-system deploy/istiod -n istio-system -- curl localhost:15014/metrics | grep convergence# Result
# le초 이내로 Istio-Proxy에 설정을 주입한 건수가 42개
pilot_proxy_convergence_time_bucket{le="0.1"} 42
pilot_proxy_convergence_time_bucket{le="0.5"} 42
pilot_proxy_convergence_time_bucket{le="1"} 42
pilot_proxy_convergence_time_bucket{le="3"} 42
pilot_proxy_convergence_time_bucket{le="5"} 42
pilot_proxy_convergence_time_bucket{le="10"} 42
pilot_proxy_convergence_time_bucket{le="20"} 42
pilot_proxy_convergence_time_bucket{le="30"} 42
pilot_proxy_convergence_time_bucket{le="+Inf"} 42
pilot_proxy_convergence_time_sum 0.086078397
pilot_proxy_convergence_time_count 42kubectl exec -it -n istio-system deploy/istiod -n istio-system -- curl localhost:15014/metrics | grep pilot | egrep 'service|^pilot_xds'
# Result
pilot_services 7 # 현재 Control Plane에 등록된 Service 갯수
pilot_virt_services 1 # 사용자가 생성한 VirtualService 갯수
pilot_vservice_dup_domain 0 # 동일한 도메인을 사용하는 VirtualService의 갯수
pilot_xds{version="1.17.8"} 4 # 현재 Istio에 배포된 Istio-proxy의 갯수
3.Prometheus로 Istio Metric 가져오기
Prometheus란?
사운드 클라우드에서 시작된 Metric 수집 엔진 이며, 모니터링 및 얼럿 도구들의 집합 입니다.
Prometheus 는 다른 수집기와 다르게 저장소로 Metric을 Push로 보내는 방식이 아닌 pull 방식 으로 Metric을 가져옵니다.
Prometheus 는 HTTP 클라이언트나 브라우저를 통해 Metric EndPoint를 살펴 볼 수 있습니다.

# Prometheus가 수집하는 Metric Port 15090
kubectl exec -it deploy/webapp -c istio-proxy -n istioinaction -- curl localhost:15090/stats/prometheus
# Result
# Proemtheus가 이해할 수 있는 형식으로 Metric이 출력되는 것을 확인 할 수 있습니다.
...
istio_response_bytes_count{reporter="source",source_workload="webapp",source_canonical_service="webapp",source_canonical_revision="latest",source_workload_namespace="istioinaction",source_principal="spiffe://cluster.local/ns/istioinaction/sa/webapp",source_app="webapp",source_version="",source_cluster="Kubernetes",destination_workload="catalog",destination_workload_namespace="istioinaction",destination_principal="spiffe://cluster.local/ns/istioinaction/sa/catalog",destination_app="catalog",destination_version="v1",destination_service="catalog.istioinaction.svc.cluster.local",destination_canonical_service="catalog",destination_canonical_revision="v1",destination_service_name="catalog",destination_service_namespace="istioinaction",destination_cluster="Kubernetes",request_protocol="http",response_code="200",grpc_response_status="",response_flags="-",connection_security_policy="unknown"} 3Prometheus와 Grafna 설정하기
# 실습 준비 kube-prometheus-stack 설치

helm repo add prometheus-community https://prometheus-community.github.io/helm-charts
helm repo update

cat << EOF > prom-values-2.yaml
prometheusOperator:
  tls:
    enabled: false
  admissionWebhooks:
    patch:
      enabled: false

prometheus:
  service:
    type: NodePort
    nodePort: 30001

grafana:
  service:
    type: NodePort
    nodePort: 30002
EOF

kubectl create ns prometheus
helm install prom prometheus-community/kube-prometheus-stack --version 13.13.1 \
-n prometheus -f ch7/prom-values.yaml -f prom-values-2.yaml

# Prometheus 접속
wslview http://127.0.0.1:30001


# Grafana 접속
wslview http://127.0.0.1:30002
Prometheus의 Istio Control Plane과 Data Plane 정보 수집 설정
앞에서 설치한 Prometheus는 Istio의 Control Plane과 Data Plane의 정보를 가져가는 방법을 모르기 때문에 설정을 진행해보도록 하겠습니다.
이때 Prometheus의 Operator에 있는 CR ServiceMonitor, PodMonitor 를 이용하여 설정 진행 하겠습니다.


cat ch7/service-monitor-cp.yaml
kubectl apply -f ch7/service-monitor-cp.yaml -n prometheus

# 호출 테스트
kubectl exec -it netshoot -- curl -s istiod.istio-system:15014/metrics
kubectl exec -it netshoot -- curl -s istiod.istio-system:15014/metrics | grep pilot_xds
kubectl exec -it netshoot -- curl -s istiod.istio-system:15014/metrics | grep citadel
apiVersion: monitoring.coreos.com/v1
kind: ServiceMonitor
metadata:
name: istio-component-monitor
namespace: prometheus
labels:
monitoring: istio-components
release: prom
spec:
jobLabel: istio
targetLabels: [app]
selector:
matchExpressions:
- {key: istio, operator: In, values: [pilot]}
namespaceSelector:
any: true
endpoints:
- port: http-monitoring # 15014
interval: 15s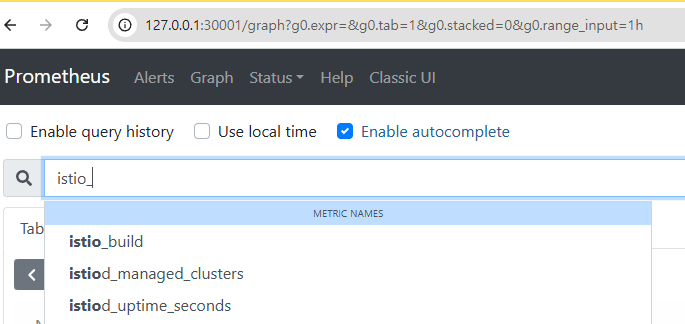
cat ch7/pod-monitor-dp.yaml
kubectl apply -f ch7/pod-monitor-dp.yaml -n prometheus

# 접속 테스트
WEBAPP=$(kubectl get pod -n istioinaction -l app=webapp -o jsonpath='{.items[0].status.podIP}')
kubectl exec -it netshoot -- curl -s $WEBAPP:15020/stats/prometheus
apiVersion: monitoring.coreos.com/v1
kind: PodMonitor
metadata:
name: envoy-stats-monitor
namespace: prometheus
labels:
monitoring: istio-proxies
release: prom
spec:
selector:
matchExpressions:
- {key: istio-prometheus-ignore, operator: DoesNotExist}
namespaceSelector:
any: true
jobLabel: envoy-stats
podMetricsEndpoints:
- path: /stats/prometheus
interval: 15s
relabelings:
- action: keep
sourceLabels: [__meta_kubernetes_pod_container_name]
regex: "istio-proxy"
- action: keep
sourceLabels: [__meta_kubernetes_pod_annotationpresent_prometheus_io_scrape]
- sourceLabels: [
__address__, __meta_kubernetes_pod_annotation_prometheus_io_port]
action: replace
regex: ([^:]+)(?::\d+)?;(\d+)
replacement: $1:$2
targetLabel: __address__
- action: labeldrop
regex: "__meta_kubernetes_pod_label_(.+)"
- sourceLabels: [__meta_kubernetes_namespace]
action: replace
targetLabel: namespace
- sourceLabels: [__meta_kubernetes_pod_name]
action: replace
targetLabel: pod_name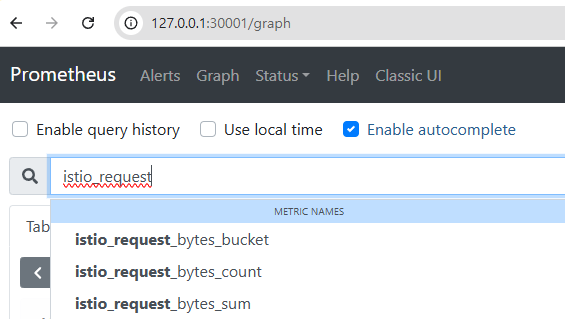
4.Istio 표준 Metric 커스터마이징하기
Istio는 Envoy Proxy SideCar에 플러그인을 을 이용하여 Metric 표시, 커스터마이징, 생성되는 방법들을 설정 할 수 있습니다.
커스터마이징을 하기 전에 우선 Metric, Dimension, Attribute 에 대한 개념을 우선 알아야 합니다.
Metric
- 서비스 호출 간 Telemetry의
Counter, Gauge, Histogram, Distribution과 같은 측정 값을 말합니다.Counter:항상 증가만 하는 누적 지표입니다.Gauge:: 특정 시점의 값을 나타내는 지표입니다Histogram, Distribution:특정 값들의 분포 상태를 나타냅니다.
Dimension
- Metric을 분류하기 위한
라벨 및 태그를 의미합니다.- Ex) 요청 메서드(Request Method)별 요청 수를 알고 싶을 때 사용
Attribute
- Envoy Proxy에서 수집된
원본 데이터를 의미합니다.- Ex) request.code Dimension은 request.code Attribute를 기반으로 생성
기존 Metric 수정하기
Istio Metric은 Istio 설치 시 설치되는 EnvoyFilter CRD 를 사용하여 stats Proxy 플러그인에서 설정합니다.
하단 예시의 Envoy Filter는 istio.stats 라는 필터를 직접 구성하는 예제이며, 해당 필터는 통계 기능 을 구현 하는 WASM 플러그인입니다.
kubectl get envoyfilter stats-filter-1.13 -n istio-system -o yaml...
spec:
configPatches:
- applyTo: HTTP_FILTER
match:
context: SIDECAR_OUTBOUND
listener:
filterChain:
filter:
name: envoy.filters.network.http_connection_manager
subFilter:
name: envoy.filters.http.router
proxy:
proxyVersion: ^1\.13.*
patch:
operation: INSERT_BEFORE
value:
name: istio.stats # 필터 이름
typed_config:
'@type': type.googleapis.com/udpa.type.v1.TypedStruct
type_url: type.googleapis.com/envoy.extensions.filters.http.wasm.v3.Wasm
value:
config: # 필터 설정
configuration:
'@type': type.googleapis.com/google.protobuf.StringValue
value: |
{
"debug": "false",
"stat_prefix": "istio"
}
...기존 Metric에 디멘션 추가하기
cat ch7/metrics/istio-operator-new-dimensions.yaml
# 기존 설정 확인
kubectl get istiooperator installed-state -n istio-system -o yaml | grep -E "prometheus:|telemetry:" -A2

# request_protocol 디멘션 확인
kubectl -n istioinaction exec -it deploy/webapp -c istio-proxy \
-- curl localhost:15000/stats/prometheus | grep istio_requests_total | grep request_protocol
apiVersion: install.istio.io/v1alpha1
kind: IstioOperator
spec:
profile: demo
values:
telemetry:
v2:
prometheus:
configOverride:
inboundSidecar:
metrics:
- name: requests_total
dimensions: # 추가한 새 디멘션
upstream_proxy_version: upstream_peer.istio_version
source_mesh_id: node.metadata['MESH_ID']
tags_to_remove: # 제거한 태그 목록
- request_protocol
...# Result
telemetry:
enabled: true
v2:
--
prometheus:
enabled: true
wasmEnabled: false
# Result 2
...
request_protocol="http" # 확인
# 설정 적용
docker exec -it myk8s-control-plane bash
# 파일 작성
cat << EOF > istio-operator-new-dimensions.yaml
apiVersion: install.istio.io/v1alpha1
kind: IstioOperator
spec:
  profile: demo
  values:
    telemetry:
      v2:
        prometheus:
          configOverride:
            inboundSidecar:
              metrics:
              - name: requests_total
                dimensions:
                  upstream_proxy_version: upstream_peer.istio_version
                  source_mesh_id: node.metadata['MESH_ID']
                tags_to_remove:
                - request_protocol
            outboundSidecar:
              metrics:
              - name: requests_total
                dimensions:
                  upstream_proxy_version: upstream_peer.istio_version
                  source_mesh_id: node.metadata['MESH_ID']
                tags_to_remove:
                - request_protocol
            gateway:
              metrics:
              - name: requests_total
                dimensions:
                  upstream_proxy_version: upstream_peer.istio_version
                  source_mesh_id: node.metadata['MESH_ID']
                tags_to_remove:
                - request_protocol
EOF
 # 리소스별로 적용결과를 출력
istioctl install -f istio-operator-new-dimensions.yaml -y

# 터미널 나오기
exit

# 변경사항 확인
kubectl get istiooperator -n istio-system installed-state -o yaml | grep -E "prometheus:" -A9
...
        prometheus:
          configOverride:
            gateway:
              metrics:
              - dimensions:
                  source_mesh_id: node.metadata['MESH_ID']
                  upstream_proxy_version: upstream_peer.istio_version
                name: requests_total
                tags_to_remove:
                - request_protocol
...
kubectl get envoyfilter stats-filter-1.13 -n istio-system -o yaml...
name: istio.stats
typed_config:
'@type': type.googleapis.com/udpa.type.v1.TypedStruct
type_url: type.googleapis.com/envoy.extensions.filters.http.wasm.v3.Wasm
value:
config:
configuration:
'@type': type.googleapis.com/google.protobuf.StringValue
value: |
{"metrics":[{"dimensions":{"source_mesh_id":"node.metadata['MESH_ID']","upstream_proxy_version":"upstream_peer.istio_version"},"name":"requests_total","tags_to_remove":["request_protocol"]}]}
root_id: stats_outbound
...
kubectl -n istioinaction exec -it deploy/webapp -c istio-proxy -- curl localhost:15000/stats/prometheus | grep istio_requests_total | grep request_protocol
# 수행 결과 출력 되지 않음
Telemetry 리소스로도 Dimension을 추가 및 삭제를 할 수 있습니다.
cat ch7/metrics/v2/add-dimensions-telemetry.yaml
kubectl apply -n istioinaction -f ch7/metrics/v2/add-dimensions-telemetry.yaml
apiVersion: telemetry.istio.io/v1alpha1
kind: Telemetry
metadata:
name: add-dimension-tags
namespace: istioinaction
spec:
metrics:
- providers:
- name: prometheus
overrides:
- match:
metric: REQUEST_COUNT
mode: CLIENT_AND_SERVER
disabled: false
tagOverrides:
upstream_proxy_version:
operation: UPSERT
value: upstream_peer.istio_version
source_mesh_id:
operation: UPSERT
value: node.metadata['MESH_ID']
request_protocol:
operation: REMOVE새로운 Metric 만들기
기존 Metric을 수정하는 것이 아닌, 신규 Metric을 생성 하는 경우 stats 플러그인에 새 Metric을 정의하여 생성 하면됩니다.
docker exec -it myk8s-control-plane bash
cat << EOF > istio-operator-new-metric.yaml
apiVersion: install.istio.io/v1alpha1
kind: IstioOperator
spec:
  profile: demo
  values:
    telemetry:
      v2:
        prometheus:
          configOverride:
            inboundSidecar:
              definitions:
              - name: get_calls # istio_ 접두사는 자동으로 붙음
                type: COUNTER # GAUGE, HISTOGRAM도 선택 가능
                value: "(request.method.startsWith('GET') ? 1 : 0)"
            outboundSidecar:
              definitions:
              - name: get_calls
                type: COUNTER
                value: "(request.method.startsWith('GET') ? 1 : 0)"
            gateway:
              definitions:
              - name: get_calls
                type: COUNTER
                value: "(request.method.startsWith('GET') ? 1 : 0)"
EOF

# 리소스별로 적용결과를 출력
istioctl verify-install -f istio-operator-new-metric.yaml istioctl install -f istio-operator-new-metric.yaml -y

# 출력 결과 확인
kubectl get envoyfilter -n istio-system stats-filter-1.13 -o yaml | grep get_calls
새 속성으로 호출 그룹화 하기
기존 속성을기반으로 더 세분화 하거나, 응용하여 새로운 속성을 만들 수 있습니다.
이번 예제를 통해서는 request.path_url와 request.method 속성을 조합하여, Istio_operationId 속성을 만들 예정입니다.
해당 속성을 통해 GET 호출 갯수를 파악 할 수 있습니다.
그룹화를 하기 위해서는 Attribute-gen 이라는 Proxy 플러그인 을 사용하며 이 플러그인은 stats플러그인 보다 먼저 적용 됩니다.
# proxyVersion을 1.17로 변경
vi ch7/metrics/attribute-gen.yaml
      proxy:
        proxyVersion: ^1\.13.* # ^1\.17.*로 변경
cat ch7/metrics/attribute-gen.yaml
kubectl apply -f ch7/metrics/attribute-gen.yaml -n istioinaction
# istio_operationId 속성에 대하여 /item으로 오는 GET, POST, DELETE 요청들에 대한 호출 수집
apiVersion: networking.istio.io/v1alpha3
kind: EnvoyFilter
metadata:
  name: attribute-gen-example
  namespace: istioinaction
spec:
  configPatches:
  - applyTo: HTTP_FILTER
    match:
      context: SIDECAR_OUTBOUND
      listener:
        filterChain:
          filter:
            name: envoy.filters.network.http_connection_manager
            subFilter:
              name: istio.stats
...
 typed_config:
          '@type': type.googleapis.com/udpa.type.v1.TypedStruct
          type_url: type.googleapis.com/envoy.extensions.filters.http.wasm.v3.Wasm
          value:
            config:
              configuration:
                '@type': type.googleapis.com/google.protobuf.StringValue
                value: |
                  {
                    "attributes": [
                      {
                        "output_attribute": "istio_operationId", # 속성 이름
                        "match": [
                         {
                           "value": "getitems", # 속성 값
                           "condition": "request.url_path == '/items' && request.method == 'GET'"
                         },
                         {
                           "value": "createitem",
                           "condition": "request.url_path == '/items' && request.method == 'POST'"
                         },
                         {
                           "value": "deleteitem",
                           "condition": "request.url_path == '/items' && request.method == 'DELETE'"
                         }
                       ]
                      }
                    ]
                  }
              vm_config:
                code:
                  local:
                    inline_string: envoy.wasm.attributegen
# stats 플러그인 설정 업데이트
docker exec -it myk8s-control-plane bash
cat << EOF > istio-operator-new-attribute.yaml
apiVersion: install.istio.io/v1alpha1
kind: IstioOperator
spec:
profile: demo
values:
telemetry:
v2:
prometheus:
configOverride:
outboundSidecar:
metrics:
- name: requests_total
dimensions:
upstream_operation: istio_operationId # 새 디멘션에 추가
EOF
# 리소스별로 적용결과를 출력
istioctl verify-install -f istio-operator-new-attribute.yaml
# stats 플러그인 업데이트 적용
istioctl install -f istio-operator-new-attribute.yaml -y
# OutboundSidecar에만 적용되는 것 확인
kubectl get istiooperator -n istio-system installed-state -o yaml | grep -B2 -A1 istio_operationId$
# 호출테스트
for in in {1..100}; do curl -s http://webapp.istioinaction.io:30000/api/catalog ; sleep 0.5; done# OutboundSidecar Result
metrics:
- dimensions:
upstream_operation: istio_operationId
name: requests_total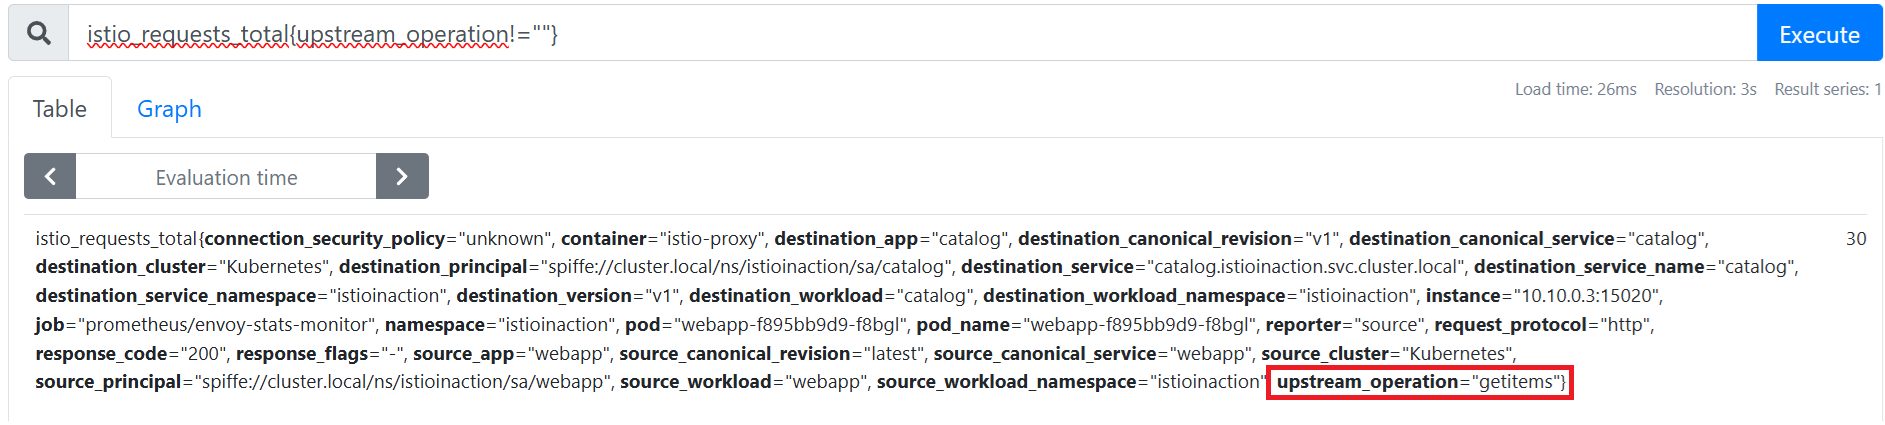
'DevOps > Study' 카테고리의 다른 글
| Istio Hands-on Study [1기] [5주차] (1) | 2025.05.11 |
|---|---|
| Istio Hands-on Study [1기] [4주차 2/2] Observability 서비스 시각화하기 (1) | 2025.05.04 |
| Istio Hands-on Study [1기] [3주차 2/2] Application Network 문제 해결하기 (0) | 2025.04.27 |
| Istio Hands-on Study [1기] [3주차 1/2] Traffic Management (0) | 2025.04.26 |
| Istio Hands-on Study [1기] [2주차 2/2] Istio Gateway (0) | 2025.04.20 |